
Obesity Rate in America: What the Latest U.S. Statistics Reveal
Obesity has become one of America’s most widespread health concerns. And the latest numbers show just how deeply it affects the country.
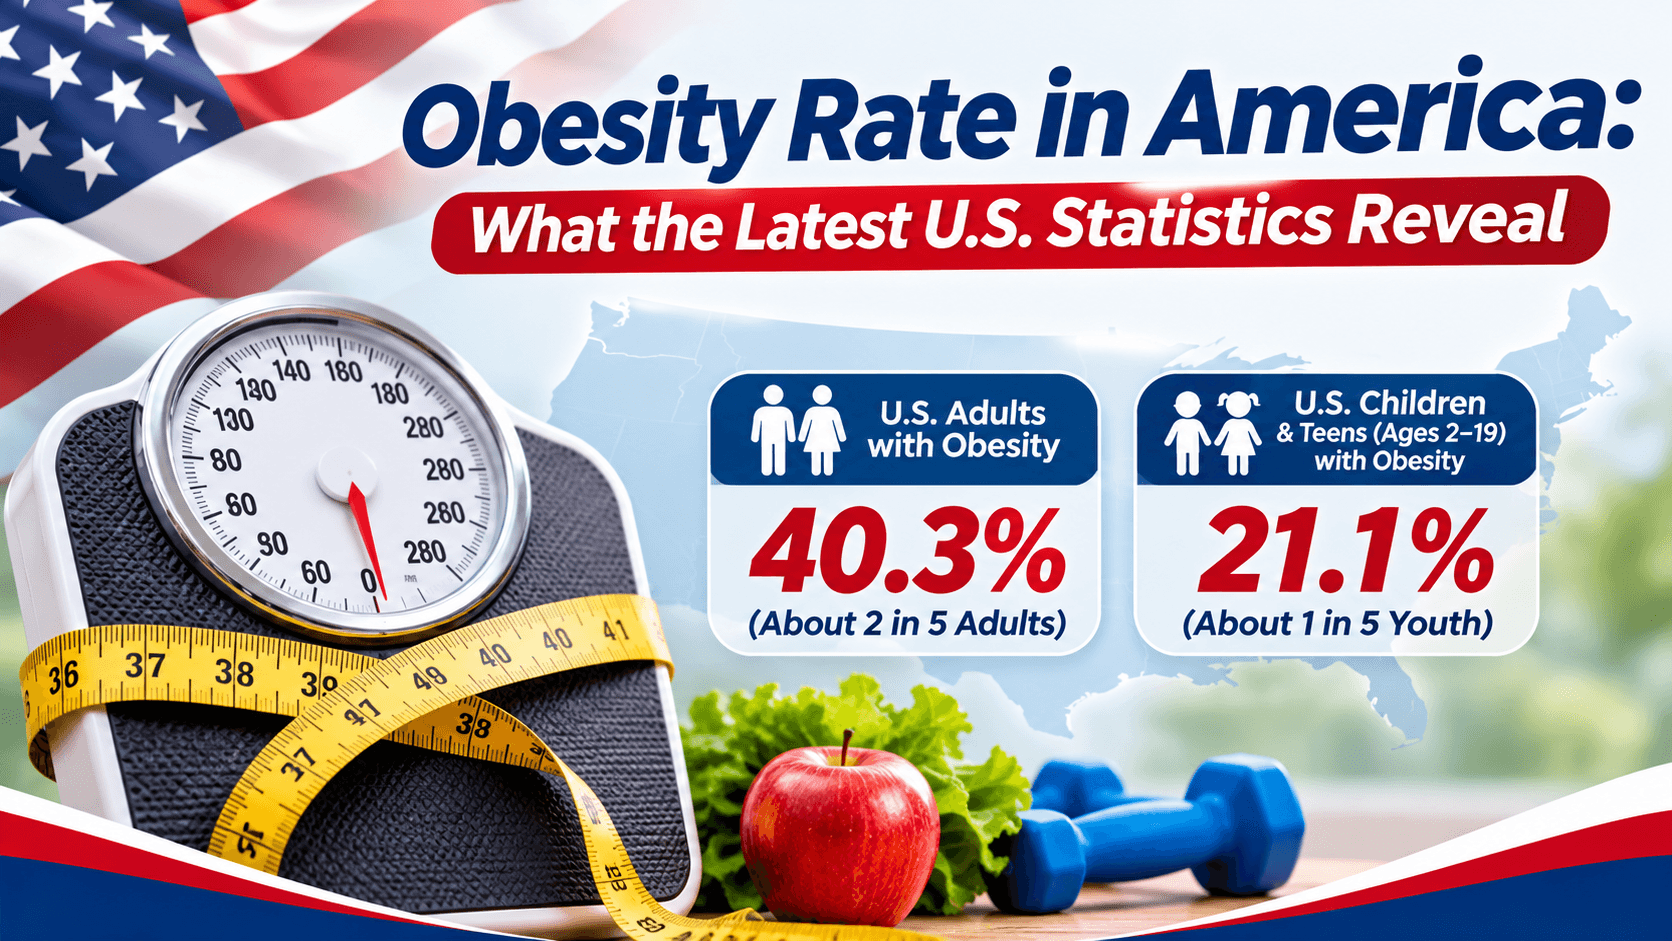
According to the Centers for Disease Control and Prevention (CDC), 40.3% of American adults have obesity. That means roughly two out of every five adults fall into this category.
But the national average doesn’t tell the whole story.
Obesity rates differ across age groups, states, and communities. Middle-aged adults face particularly high prevalence, while severe obesity has become more common over the long term.
The reasons are more complicated than eating habits alone. Genetics, access to healthcare, daily routines, medications, food environments, and economic circumstances can all influence weight.
Here’s what the latest available obesity statistics reveal about America—and what they mean for public health.
What Is the Current Obesity Rate in America?
The latest nationally representative CDC data based on measured height and weight show that 40.3% of U.S. adults ages 20 and older had obesity during August 2021–August 2023.
These estimates come from the National Health and Nutrition Examination Survey (NHANES).
A CDC report published in February 2026 also confirmed the following estimates for that survey period.
| Weight category | U.S. adults |
|---|---|
| Overweight, excluding obesity | 32.1% |
| Obesity | 40.3% |
| Severe obesity | 9.4% |
| Overweight or obesity combined | 72.4% |
Source: CDC/NCHS, NHANES August 2021–August 2023. Severe obesity is included within obesity, not added to it.
For adults, obesity is generally defined as having a body mass index (BMI) of 30 or higher. Severe obesity is defined as a BMI of 40 or higher.
BMI doesn’t measure body fat directly or provide a complete picture of an individual’s health. However, it remains a widely used screening measure for understanding weight-related health patterns across large populations.
The key finding is clear: obesity affects a substantial proportion of American adults.
Which Age Group Has the Highest Obesity Rate?
Obesity is not distributed evenly across adulthood.
CDC measurements show that Americans between ages 40 and 59 have the highest obesity prevalence.
| Age group | Obesity rate |
|---|---|
| Adults 20–39 | 35.5% |
| Adults 40–59 | 46.4% |
| Adults 60 and older | 38.9% |
Source: CDC/NCHS, August 2021–August 2023.
Nearly half of adults in their 40s and 50s were classified as having obesity.
Middle age often comes with changes in physical activity, sleep patterns, body composition, family responsibilities, and work routines.
For some people, long hours at a desk make regular exercise difficult. Others may experience weight changes associated with medications, medical conditions, or hormonal transitions.
These factors can interact, and their effects vary considerably from person to person.
The important takeaway: Weight-related health risks deserve attention throughout adulthood, especially during the middle years when national obesity prevalence is highest.
Is Obesity More Common in Men or Women?
The difference between men and women is smaller than many people might expect.
CDC figures show:
| Category | Men | Women |
|---|---|---|
| Obesity | 39.2% | 41.3% |
| Severe obesity | 6.7% | 12.1% |
Source: CDC/NCHS, August 2021–August 2023.
Overall obesity prevalence was not significantly different between men and women.
However, severe obesity was substantially more common among women.
This distinction matters because severe obesity is associated with increased risks of several chronic conditions and may require more intensive medical treatment.
The data also reinforce why looking at a single national percentage can hide important differences within the population.
Which States Have the Highest Obesity Rates?
Where Americans live can influence their access to nutritious food, healthcare services, recreational spaces, and opportunities for physical activity.
The CDC’s 2025 Adult Obesity Prevalence Maps, released in September 2026, show considerable variation across the country.
The following are selected examples of state and district obesity rates.
| State or district | Adult obesity rate |
|---|---|
| Alabama | 39.7% |
| Arkansas | 36.7% |
| Delaware | 36.3% |
| Colorado | 25.7% |
| District of Columbia | 24.2% |
Source: CDC Behavioral Risk Factor Surveillance System (BRFSS), 2025. These are selected locations, not a full ranking.
Alabama reported a rate close to 40%, while the District of Columbia reported a substantially lower percentage.
Regional differences also stand out.
| U.S. region | Adult obesity rate |
|---|---|
| Midwest | 35.5% |
| South | 34.8% |
| West | 30.7% |
| Northeast | 29.6% |
Source: CDC BRFSS, 2025.
The Midwest and South had the highest regional prevalence.
These differences may reflect several interacting factors, including income, education, local food environments, transportation, healthcare access, and opportunities for exercise.
They should not be interpreted as proof that people in one state make better or worse personal choices.
Important: State estimates rely on self-reported height and weight, while the national NHANES estimates use physical measurements. The two sources should not be compared as though they use identical methods.
What Is the Childhood Obesity Rate in America?
Obesity is also a major concern among children and teenagers.
According to the CDC’s February 2026 report, 21.1% of U.S. children and adolescents ages 2–19 had obesity during August 2021–August 2023.
That’s approximately one in five young people.
Rates differ by age.
| Age group | Obesity rate |
|---|---|
| Children 2–5 | 14.9% |
| Children 6–11 | 22.1% |
| Adolescents 12–19 | 22.9% |
Source: CDC/NCHS, NHANES August 2021–August 2023.
Obesity prevalence was higher among school-aged children and adolescents than among preschool-aged children.
Childhood obesity can increase the likelihood of developing conditions such as high blood pressure, type 2 diabetes, and other health problems.
However, childhood obesity is assessed differently from adult obesity.
Healthcare professionals use age- and sex-specific BMI percentiles, along with growth patterns and other clinical information.
The goal is not to focus narrowly on a child’s weight. It is to support healthy growth, appropriate nutrition, physical activity, sleep, and access to healthcare.
Has America’s Obesity Rate Increased Over Time?
America’s obesity problem developed over decades.
But the most recent trends are more complicated than a simple year-by-year increase.
CDC data show the following age-adjusted obesity estimates.
| Survey period | Adult obesity | Severe obesity |
|---|---|---|
| 2013–2014 | 37.7% | 7.7% |
| 2015–2016 | 39.6% | 7.7% |
| 2017–2020 | 41.9% | 9.2% |
| 2021–2023 | 40.3% | 9.7% |
Source: CDC/NCHS. Age-adjusted estimates; survey periods are not single calendar years.
At first glance, the decrease from 41.9% to 40.3% might appear encouraging.
However, the CDC reported that the change between the two most recent survey periods was not statistically significant.
The longer-term story is more concerning for severe obesity.
Between 2013–2014 and August 2021–August 2023, age-adjusted severe obesity prevalence increased from 7.7% to 9.7%, a statistically significant upward trend.
That means America’s obesity problem remains widespread, even when short-term survey estimates fluctuate.
Why Is Obesity So Common in America?
It’s tempting to explain obesity through diet and exercise alone.
But that’s only part of the picture.
Obesity is a complex chronic condition that develops through the interaction of biological, behavioral, environmental, and social factors.
Several influences can increase risk.
Food environments: Highly accessible, calorie-dense foods and large portions can make it harder to maintain an eating pattern that supports long-term health.
Physical inactivity: Jobs that involve extended sitting, limited recreational space, and car-dependent communities may reduce opportunities for daily movement.
Sleep and stress: Poor sleep and chronic stress can affect appetite regulation, eating behavior, and overall health.
Genetics: Some people have inherited characteristics that influence appetite, energy regulation, and susceptibility to weight gain.
Health conditions and medications: Certain medical problems and treatments can contribute to weight changes.
Social and economic factors: Food costs, working hours, neighborhood safety, healthcare access, and education can shape the choices available to individuals.
No single factor explains every person’s experience.
That’s why effective obesity prevention and treatment need to consider the circumstances surrounding health—not just individual behavior.
What Health Problems Are Linked to Obesity?
Obesity is associated with an increased risk of several chronic diseases.
The CDC identifies links between obesity and conditions such as:
- Type 2 diabetes
- High blood pressure
- Heart disease and stroke
- Sleep apnea
- Osteoarthritis
- Certain cancers
- Reduced physical functioning
These associations don’t mean everyone with obesity will develop these conditions.
A person’s actual health risk depends on many factors, including age, body-fat distribution, blood pressure, blood sugar, genetics, physical fitness, and existing medical conditions.
Still, when obesity affects such a large share of the population, the impact on healthcare systems and communities can be substantial.
Can America’s Obesity Rate Be Reduced?
There is no single solution that works for everyone.
But prevention and treatment can make a meaningful difference.
Regular physical activity, nutritious eating patterns, adequate sleep, and appropriate healthcare support can help people improve metabolic health and manage their weight.
For those living with obesity, treatment may include structured behavioral support, nutrition counseling, prescription weight-management medications, or bariatric surgery when clinically appropriate.
Healthcare professionals may also focus on improving blood pressure, blood glucose, cholesterol, sleep, mobility, and quality of life.
Public health policies matter as well.
Improving access to affordable nutritious foods, safe walking areas, recreational facilities, and evidence-based healthcare can help communities support healthier lives.
The goal should be sustainable improvement, not unrealistic expectations or rapid weight loss.
The Bottom Line
America’s obesity rate remains a significant public health concern.
The latest nationally representative measured figures show that 40.3% of adults and 21.1% of children and adolescents have obesity.
Middle-aged adults have the highest adult prevalence, while severe obesity has increased over the longer term.
The numbers also reveal substantial differences across states, regions, and population groups.
But obesity is more than a statistic.
It reflects a combination of genetics, health conditions, daily routines, food environments, economic circumstances, and access to care.
Reducing obesity in America isn’t simply about lowering a percentage. It’s about helping more people live healthier lives and reducing preventable disease.
That requires accurate information, appropriate treatment, accessible healthcare, and healthier communities.
Data note: National estimates use measured NHANES data collected during August 2021–August 2023. State and regional figures use 2025 self-reported BRFSS data released in September 2026. Historical figures are age-adjusted. Differences in survey methods and statistical uncertainty should be considered when interpreting these estimates.